Homelab Pt 10 - Open-Source EDR with Wazuh
Introduction
In this post I’ll walk through the process of deploying Wazuh, an open-source endpoint detection & response (EDR) solution, within my home environment. I’ve currently got Suricata running on my OPNsense firewall to identify known-malicious traffic, but I don’t really have any insight at the endpoint OS level. This is where a solution like Wazuh is helpful.
With Wazuh, agents are deployed to endpoints which then send endpoint data to the Wazuh server for analysis. The Wazuh server will process the data to identify vulnerabilities, malicious software, suspicious user actions, etc. If an alert triggers from the Wazuh server analysis, it is then stored and indexed within the Wazuh indexer. To wrap everything together, the Wazuh dashboard is the web user interface for data visualization and analysis. All of these components are well documented by Wazuh here.
To deploy the Wazuh server, indexer, and dashboard I’ll be using Docker containerization. Docker allows for the separation of Wazuh components from the infrastructure they run on such that they can run on any system where Docker is installed with the proper system specs. Docker also makes deploying and updating applications very simple.
After Wazuh is deployed and my endpoints are enrolled, I’ll gain a very important level of visibility into the activity occurring on my endpoints. This visibility will allow me to conduct threat hunts, detect malware, detect vulnerabilities, and much more on my endpoints. Before this, however, I’ll need to get Wazuh up and running.
Docker Deployment
The host I’ll be deploying Wazuh on is running Ubuntu 22.04 virtualized on Proxmox with 4 CPU cores, 16 GB RAM, and 100 GB of storage. Docker and Docker Compose have already been installed, so I can jump right into the installation. Before this however, Wazuh recommends increasing the maximum amount of memory mapped areas that can be created on the host. To do this I’ll add vm.max_map_count=262144 into the /etc/sysctl.conf configuration file. After saving these changes and rebooting the host, I can confirm the changes stuck using sysctl vm.max_map_count. I do see the expected value, so the changes did indeed stick.

With that covered, I’ll start the installation by cloning the Wazuh docker repository to the host. Once the repo is cloned to my host, I’ll navigate to the single node directory it contains. Wazuh does support a multi-node HA deployment, but I’ll be sticking with single node for my use case. Within the single node directory, there’s a script that will automatically generate certificates that the various Wazuh components will use to securely communicate with each other. Since I plan on using these self-signed certificates, I’ll use the following command to generate them instead of providing my own with the following:
1
docker compose -f generate-indexer-certs.yml run --rm generator
This script creates the required certificates in the config/wazuh_indexer_ssl_certs directory. After running the script and enumerating the objects within that directory, I can see that the various certificates were indeed created without issue.

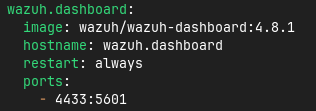
From here, I’ll make a few changes to the docker compose file used by Wazuh to initialize the containers. The contents of the default compose file can be found in Github, but the idea is that the 3 main Wazuh components (Indexer, Manager, and Dashboard) are provisioned within this file. Of course I’ll go through and change the passwords set in this fle, but I’ll also change the port that the Wazuh dashboard is served on. By default, the dashboard is served on 443 like most HTTPS applications. However, I’ve already got another application running on this host using that port, so Wazuh will have to be reassigned. This is a very simple change - I’ll literally just change the port number for the dashboard container on line 112 of the compose file to 4433 from 443.

With the default passwords changed and the dashboard port adjusted, I am now ready to spin up Wazuh. This can be done using docker compose up -d to start the containers in the background.

Once the compose command finishes, I can confirm the containers are running using docker ps -a.

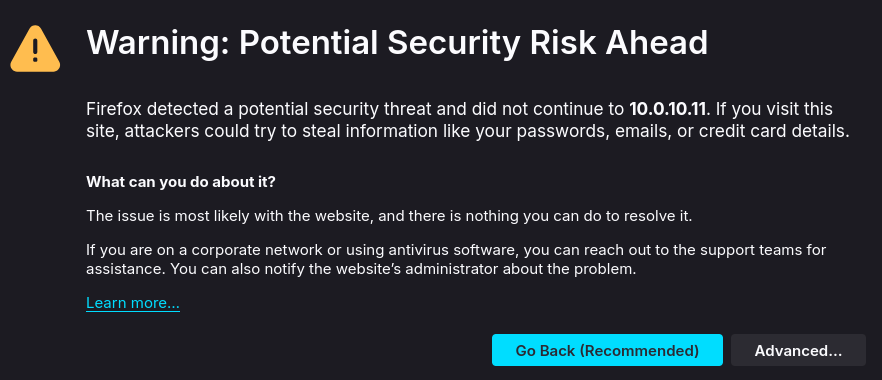
With everything looking good, I’ll head to https://SERVERIP:4433 to access the Wazuh dashboard. Since I’m using self-signed certificates I am warned that they’re untrusted by my browser.

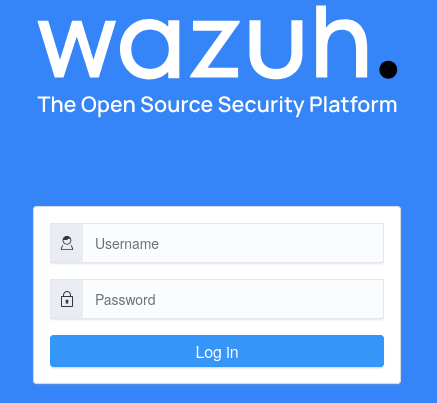
As this is expected, I’ll bypass the warning and proceed. Finally, I am met with the Wazuh login screen!

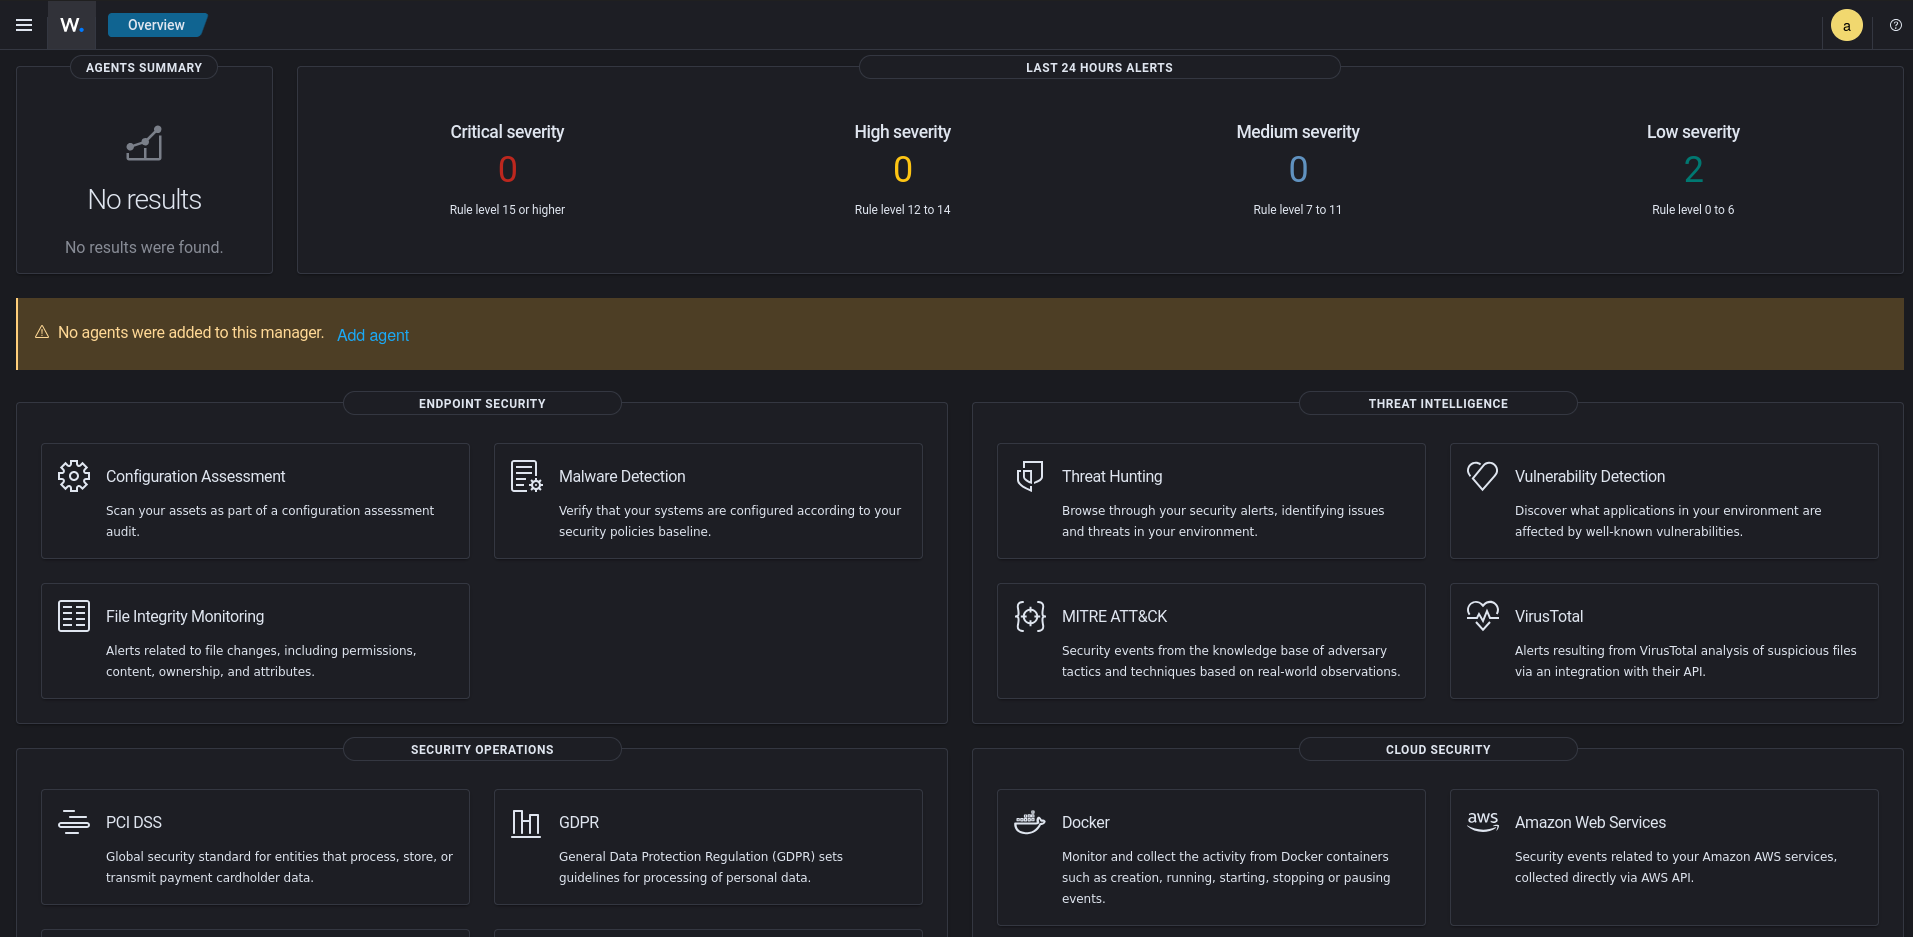
After authenticating with the credentials I previously configured, I can now see the main Wazuh dashboard. 
There are some system-level events already populated just from Wazuh running, but the data that I really want to monitor is the data from my endpoints. This is where agents come into the picture. Wazuh agents are installed on each endpoint you’d like to have Wazuh coverage on, ideally all user endpoints and as much infrastructure as possible, and send various data from that endpoint to the Wazuh manager for analysis and indexing. From there alerts can be generated from findings within the data, threat hunts can be conducted, you can get reports on your fleet’s baseline compliance, and so much more.
Of course, none of this data will be present without any agents so now I’ll work to get a few endpoints enrolled.
Opening Firewall Rules
Wazuh requires TCP 1514 to enroll agents and TCP 1515 for the continued sending of data from the agent. Because the host Wazuh is running on resides within my security tools VLAN, endpoints outside of that VLAN cannot communicate to it by default. Because of this, I’ll need to create a firewall rule for each VLAN where I’ll have endpoints monitored by Wazuh that allows 1514-1515 TCP to the security tools VLAN.
Heading over to OPNsense->Firewall->Rules, I’ll create add this firewall rule to each applicable VLAN. The example shown below is only for my applications VLAN, but I’ll also create on for my other VLANs where I’ll be enrolling devices. 
Enrolling Agents
Windows Endpoints
To install the Wazuh agent on Windows endpoints I’ll first download the agent MSI installer from Wazuh, launch an elevated PowerShell session, and cd into the directory containing the MSI.
From there, I’ll run the following commands to install the agent and start the Wazuh agent service:
1
2
3
.\wazuh-agent-4.8.1-1.msi /q WAZUH_MANAGER="WAZUH_IP"

NET START Wazuh
Linux Endpoints
Since all of the Linux endpoints within my environment are Debian-based, I’ll be using the instructions provided by Wazuh here for agent installation via apt.
To start, I’ll import Wazuh’s GPG key:
1
curl -s https://packages.wazuh.com/key/GPG-KEY-WAZUH | gpg --no-default-keyring --keyring gnupg-ring:/usr/share/keyrings/wazuh.gpg --import && chmod 644 /usr/share/keyrings/wazuh.gpg
Next, I’ll add the Wazuh apt repository to my host’s repository list:
1
echo "deb [signed-by=/usr/share/keyrings/wazuh.gpg] https://packages.wazuh.com/4.x/apt/ stable main" | tee -a /etc/apt/sources.list.d/wazuh.list
With the key imported and apt repository added, I’ll simply apt-get update to ensure my host can pull packages from the Wazuh repository. To install the agent, I’ll run the following where WAZUH_IP is the IP address of the host where Wazuh is running.
1
WAZUH_MANAGER="WAZUH_IP" apt-get install wazuh-agent
Now that the Wazuh agent is installed and pointing at the correct server, I’ll just start it up with the following:
1
2
3
systemctl daemon-reload
systemctl enable wazuh-agent
systemctl start wazuh-agent
Endpoints Dashboard
After enrolling a few Windows and Linux endpoints, I can now go to Wazuh->Server Management->Endpoint Summary to get an overview of my enrolled agents. Here I can see the agents enrolled, the numbers of enrolled agents vs offline agents, IP addresses and OS of the endpoints, etc.

Closing Thoughts
With the Wazuh components now operation and agents enrolled, Wazuh will start to receive data from the endpoints, process that data, and flag anything that may look suspicious. In fact, heading over to the Wazuh dashboard I can already see lots of medium and low severity events coming it: 
There is likely plenty of tuning to be done as ~400 findings from just 3 endpoints in a few hours is very noisy. Once the findings are at an acceptable volume, alerting and integrations into other tools such as a case management or threat intelligence platform to operationalize and enrich these findings. This is really just the tip of the iceberg when it comes to what Wazuh can achieve and I plan on doing many posts dedicated to the various functions of Wazuh.
Thanks for taking the time to read this post and feel free to reach out via LinkedIn if you have any questions!

