Homelab Pt 7 - Detecting Known Threats with Suricata
Introduction
In this post, I’ll be deploying Suricata within my network. Suricata, in my use-case, will serve as an IDS/IPS running at the firewall level. I am running OPNsense as the open-source firewall on my network and it has built-in integration of Suricata into the platform. Using this integration, Suricata will monitor all traffic flowing through OPNsense, identify traffic that matches known malicious patterns, and alert on said traffic.
In the scope of this post, I’ll have Suricata running in IDS mode meaning it will simply alert on malicious traffic and not actually drop malicious traffic it identifies. This is because solutions like Suricata can, initially, be very noisy if not baselined correctly. To try and avoid this, I’ll have Suricata running in IDS mode for a week or two, do any baselining if needed, and then turn on blocking mode to have a fully fledged IPS.
Today I’ll be enabling and configuring Suricata within OPNsense, importing various alerts from open-source threat intelligence feeds, and then sending any alerts Suricata generates to my SIEM (Graylog) for further processing.
Signature vs Behavior Based Alerting
There is a point to be made about the effectiveness of Suricata in the constantly evolving threat landscape due to it’s signature-based alerting. Suricata requires pre-loaded rules that define what it will determine as “malicious traffic”. These pre-loaded rules are curated from IoCs of previous real-world attacks where the victim shared the details. Because of this inherent requirement, if you undergo a novel attack, which wouldn’t have any Suricata rules created to identify it, then Suricata wouldn’t alert on the traffic actually being malicious since it doesn’t know to look for that pattern.
This is where NDR solutions like Corelight, Vectra, and Darktrace provide more comprehensive coverage when monitoring network traffic. Instead of using pre-defined, signature based rules to alert on malicious traffic, NDR tools look for anomalies based on behavior to identify malicious traffic. This is very similar to the distinction between anti-virus and EDR on endpoints. AV simply looks for known-bad signatures while EDR usually does that and much more by analyzing the behavior of resources on the endpoint.
I am yet to find a good open-source NDR solution, so for now I’ll be sticking with Suricata for detecting malicious network traffic. While it doesn’t provide comprehensive cover whatsoever, it is much better than no solution at all. If, at some point in the future, I find a good open-source NDR solution I’ll be sure to adopt it to ensure a layered defense where I can detect both known and unknown threats.
Configuring Suricata
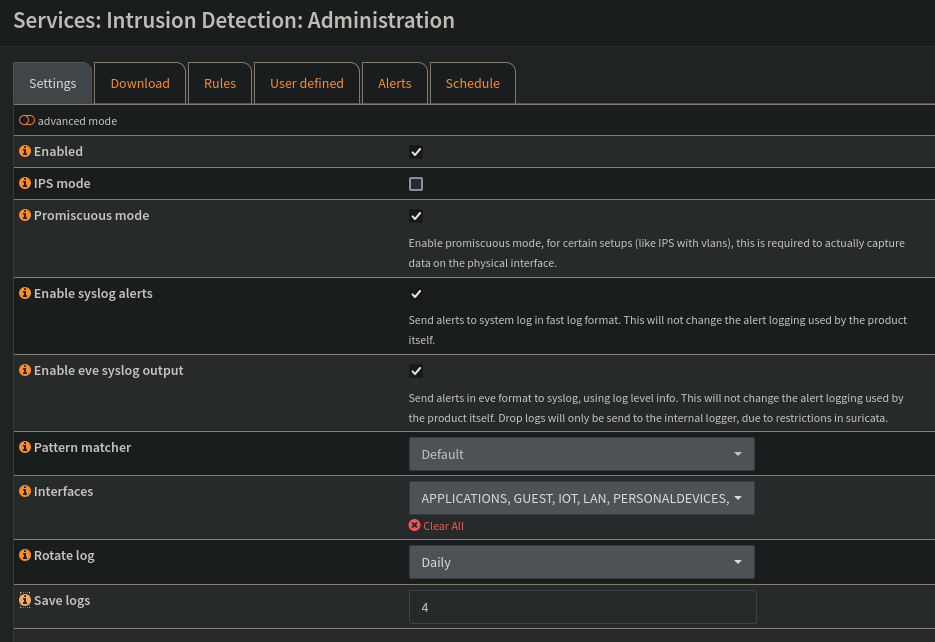
To get Suricata up and running, I’ll head to OPNsense->Services->Intrusion Detection->Administration. Here I’ll configure the high-level settings for Suricata starting with enabling it, enabling syslog alerts (so I can send alerts to Graylog), and choosing the OPNsense interfaces to monitor. I’ll choose all interfaces to ensure no traffic will go un-monitored.

After saving these changes, Suricata is now up and monitoring the interface traffic. That being said, because no rules have been imported to Suricata, it doesn’t actually know what malicious traffic looks like.
Importing Rule Sets
To import rules, I’ll head to OPNsense->Services->Intrusion Detection->Download. On this page, I am presented with the various rule sets available for download. By default, there are 3 rule set maintainers available:
- abuse.ch - Various threat intelligence-based rules from the great folks at abuse.ch
- Emerging Threats (ET) - Various threat intelligence-based rules from the great folks at Proofpoint
- OPNsense App Detectors - Various rules to detect app-specific traffic
While there are countless paid rule sets such as ET Pro offered by Proofpoint, the above 3 are provided for use at no cost to the end user. The paid rule sets are naturally of better overall quality, but for my use case I’ll be sticking with the free rule sets.
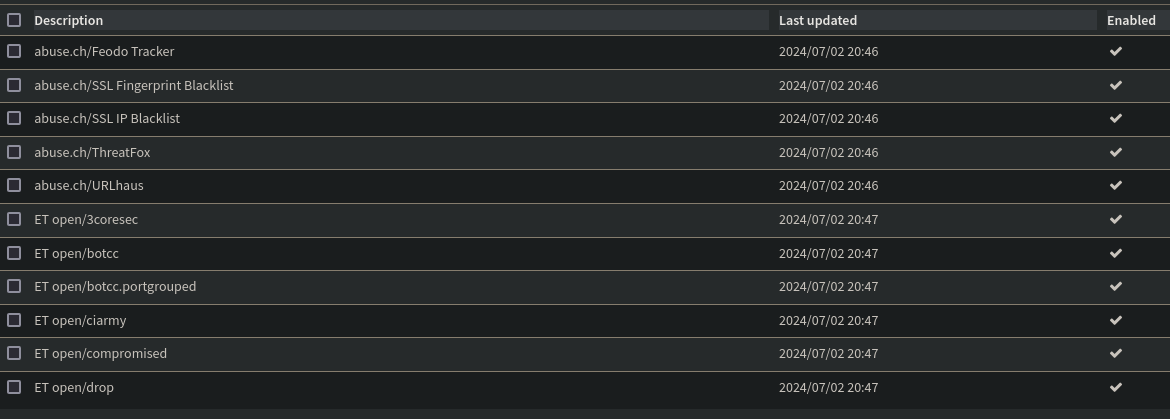
For now, I’ll import the abuse.ch and ET Open rule sets. Since I’m not concerned about app-specific traffic occurring on my network I won’t import the OPNsense app detector rule sets. This will help to ensure no compute is being wasted on analysis that won’t provide value.
After enabling the in-scope rule sets and downloading them, I can see they are up and running!

Heading over to the rules tab, I can now see each individual rule that was imported. After importing the abuse.ch and ET Open rule sets, I have 154305 rules. Suricata will now compare traffic to each of these rules to see if the traffic matches the pattern on the rule. If so, it will raise an alert and I’ll be notified of the finding. 
Auto-Updating Rule Sets
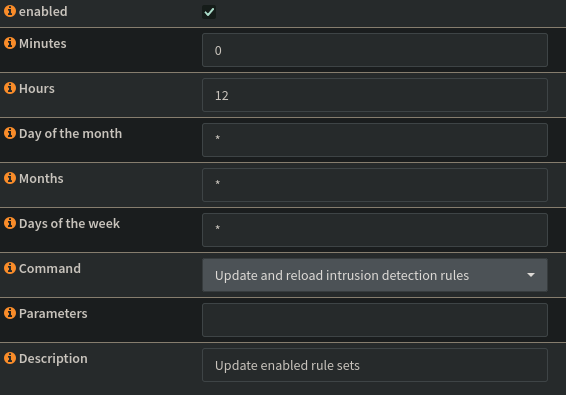
Before proceeding further, I’ll configure the rule sets to be updated every 12 hrs. This is helpful because as new threats emerge, the rule sets will be updated to include those threats. If I am not pulling the latest and greatest, my coverage would not be as comprehensive as possible. Depending on my risk tolerance, I may choose to update the rules more or less frequently.
OPNsense uses cron to schedule updates for the rule sets. To create the cron job I’ll head to OPNsense->Services->Intrusion Detection->Schedule and create the following job to update the rule sets every 12 hrs every day.

Testing Rules
With Suricata now fully up and running, I’ll try to trigger a rule to ensure everything is working as intended. Most of the rules provided by the rule sets I’ve just imported are looking for malicious traffic coming from the internet to my network, which is inherently hard to replicate as I would need access to the attack infrastructure or infect a machine on my network to make the external connection occur and trigger a Suricata alert. However, there are also plenty of rules looking for outbound traffic from my network such as an instance communicating with a known C2. These are trivial to recreate using nmap, which allows the traffic to occur without putting my endpoints at risk.
Taking a look at the abuse.ch Botnet C2 IP rule set, the following is a rule looking for traffic going out to a known Vidar C2 IP address on TCP 9000:
1
alert tcp $HOME_NET any -> [49.13.159.121] 9000
To trigger this rule, I can run the following nmap command to force my endpoint scan the IP in question on TCP 9000.
1
nmap -p 9000 49.13.159.121
Because Suricata is looking strictly at the traffic, it has no idea this is nmap that initially the traffic and views it as malicious. If my endpoint were truly a part of the Vidar botnet, the traffic pattern would match what I’ve just forced. Heading over to the Suricata alerts in OPNsense, I can see that Suricata has indeed alerted on this traffic and has marked it appropriately.

Now that the Suricata is confirmed to be working properly, I’ll get the alerts sent over to my SIEM.
Sending Alerts to Graylog
Of course, using the OPNsense web interface isn’t ideal for receiving and triaging Suricata findings. For this reason, I’ll be sending my Suricata alerts to my SIEM (Graylog) where they will be used to kick off SOAR workflows to enrich the finding, open an incident in the case management platform, quarantine endpoints, etc.
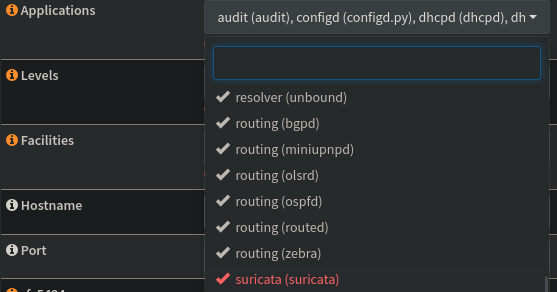
Since I already have remote logging to Graylog enabled in OPNsense, I’ll only need to add Suricata to the list of alerts that are in-scope to be sent to Graylog. To do this I’ll head to the current logging policy at OPNsense->System->Logging->Remote and add Suricata to the list of in-scope applications.

If you’re curious on getting this logging setup in the first place, check out part 5 of this series.
With the logging now enabled, I can now see that Suricata alerts are indeed flowing into Graylog. Here is an example of a log sent over from an ET INFO rule firing.

As with most logs sent to Graylog, all the relevant information is in the “message” field as one string of text. To make any automated use of these logs, I’ll need to extract the relevant information by parsing the logs.
Parsing Logs
The Suricata alert logs being shipped to Graylog follow this format:
1
2
3
4
5
6
Format:

[$SID:$GID:$REV] $RULE_NAME [Classification: $CLASSIFICATION] [Priority: $PRIORITY] {$PROTOCOL} $SRC_IP:$SRC_PORT -> $DEST_IP:$DEST_PORT

Example Log:
[1:2049796:5] ET INFO Google DNS Over HTTPS Certificate Inbound [Classification: Misc activity] [Priority: 3] {TCP} 8.8.8.8:853 -> 10.0.30.111:35568
Instead of using traditional regex to extract the relevant fields (Which would require an extractor for each field), I’ll be using GROK to extract them with a single extractor. Here is the GROK pattern I’ve created to extract the following fields: SIG, GID, REV, Rule Name, Rule Classification, Priority, Protocol, SRC/DST IP, SRC/DST Port.

After implementing this extractor and forcing the same rule to fire that I did earlier, I can now see that the relevant fields are being extracted into their own fields from the main message field. Here is a sample of the log after processing with the fields extracted:
1
2
3
4
5
6
7
8
9
10
11
12
13
14
15
16
17
18
19
20
21
22
23
24
25
26
27
28
29
30
31
32
33
34
35
36
37
38
39
40
41
42
43
44
45
46
BASE10NUM
    ["1","91292351","65234","9000"]
IPV4
    ["10.0.1.100","49.13.159.121"]
application_name
    suricata
dst_ip
    49.13.159.121
dst_port
    9000
facility
    local5
facility_num
    21
full_message
    <173>1 2024-07-03T02:11:11+00:00 OPNsense.localdomain suricata 72230 - [meta sequenceId="506813"] [1:91292351:1] ThreatFox Vidar botnet C2 traffic (ip:port - confidence level: 100%) [Classification: A Network Trojan was detected] [Priority: 1] {TCP} 10.0.1.100:65234 -> 49.13.159.121:9000
gid
    91292351
level
    5
message
    [1:91292351:1] ThreatFox Vidar botnet C2 traffic (ip:port - confidence level: 100%) [Classification: A Network Trojan was detected] [Priority: 1] {TCP} 10.0.1.100:65234 -> 49.13.159.121:9000
process_id
    72230
protocol
    TCP
rev
    1
sequenceId
    506813
sid
    1
source
    OPNsense.localdomain
src_ip
    10.0.1.100
src_port
    65234
suricata_classification
    A Network Trojan was detected
suricata_priority
    1
suricata_rule_name
    ThreatFox Vidar botnet C2 traffic (ip:port - confidence level: 100%)
timestamp
    2024-07-03 02:11:11.000
Closing Thoughts
With Suricata now monitoring my network traffic for matches to the imported rules, alerting on them, and sending logs to my SIEM I can now build out the automation to enrich the findings, open incidents, notify me, and much more with a SOAR platform. In my next post I plan on deploying DFIR IRIS as my incident management platform which will allow me to properly triage and document the resolution of incidents.
Thanks for taking the time to read this post and feel free to reach out via LinkedIn if you have any questions!

